LaTeX templates and examples — Charts
LaTeX can be used to produce a variety of different charts and diagrams, including: flowcharts, gantt charts, pie charts, branching and decision trees, family trees, histograms, bar charts and more. If you're looking for a particular type of chart that isn't featured here, please let us know, or submit your own example to the gallery.
Recent
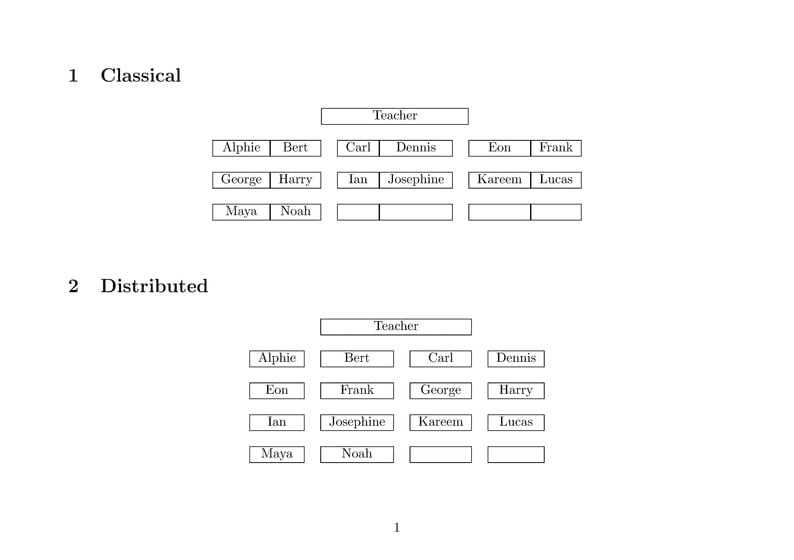
A student seating chart can be used by a teacher when indicating where students should sit in the classroom. This template has 5 suggestions: "classical", "distributed", 'lab", "U-shape" and "square". The examples show 14 students, but rows can be added manually.
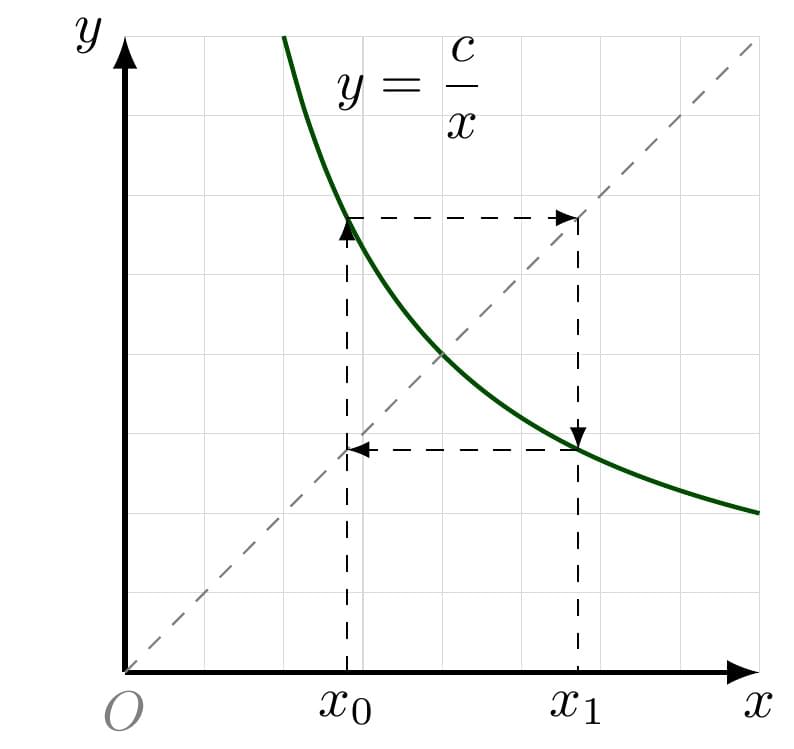
\(y=\frac{c}{x}\)
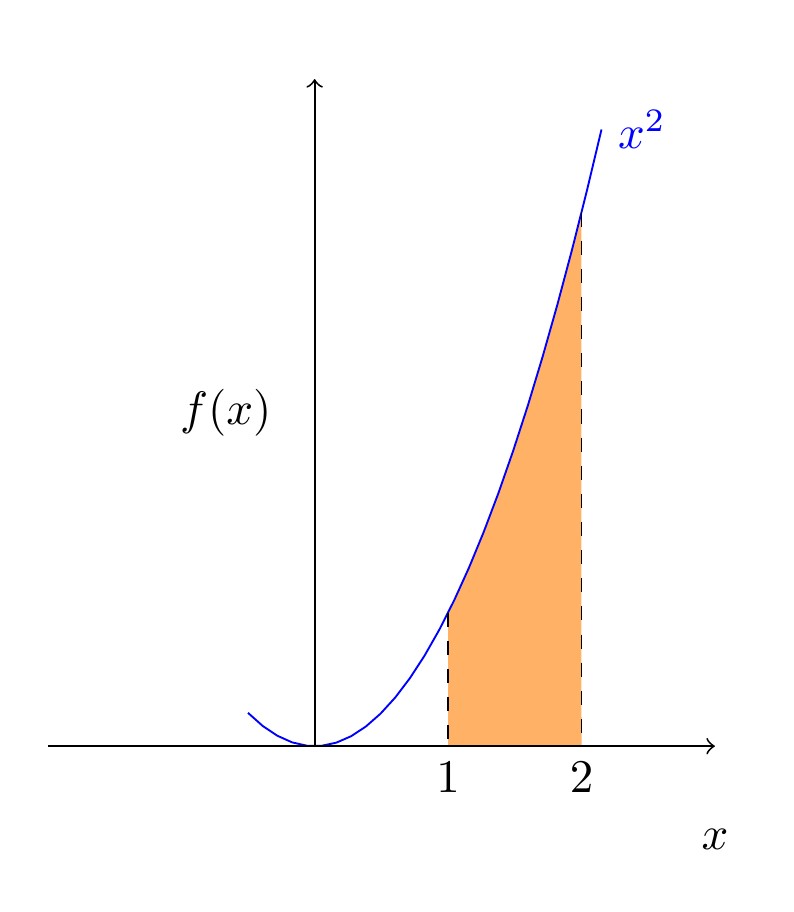
Neste projeto é apresentado o código para criar uma região colorida sob um gráfico. Para detalhes sobre o projeto: marcos.ufal.mat@gmail.com
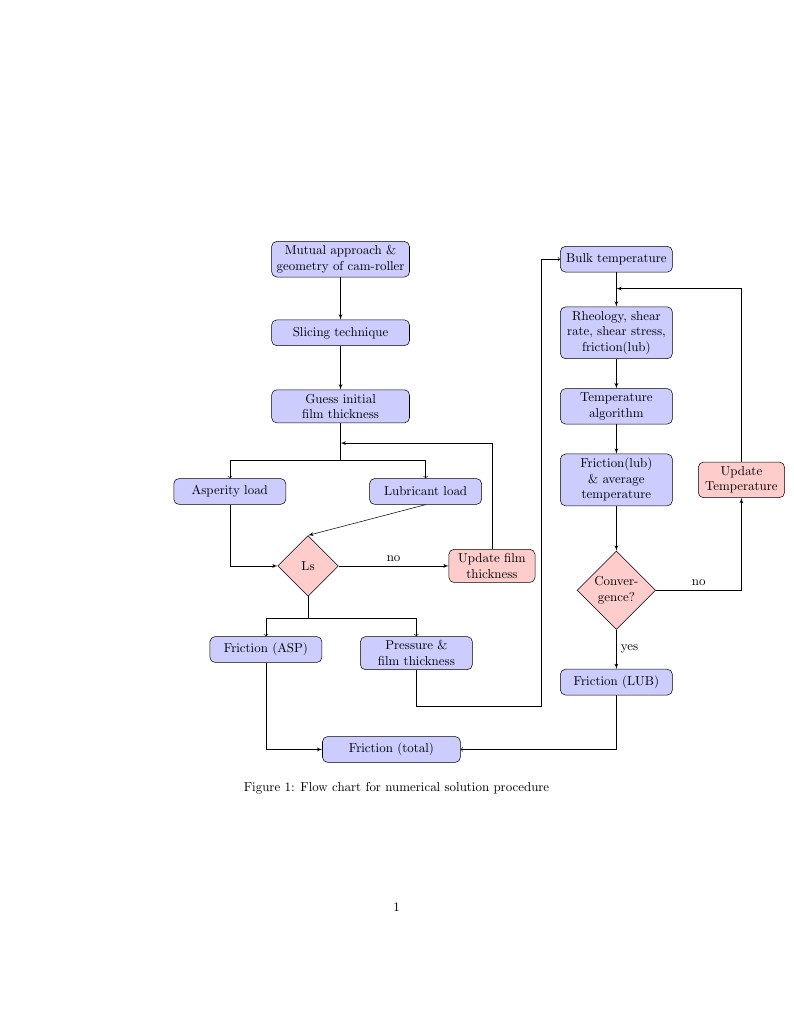
A little bit more advanced flowchart than the simple flowchart example at: http://www.texample.net/tikz/examples/simple-flow-chart/
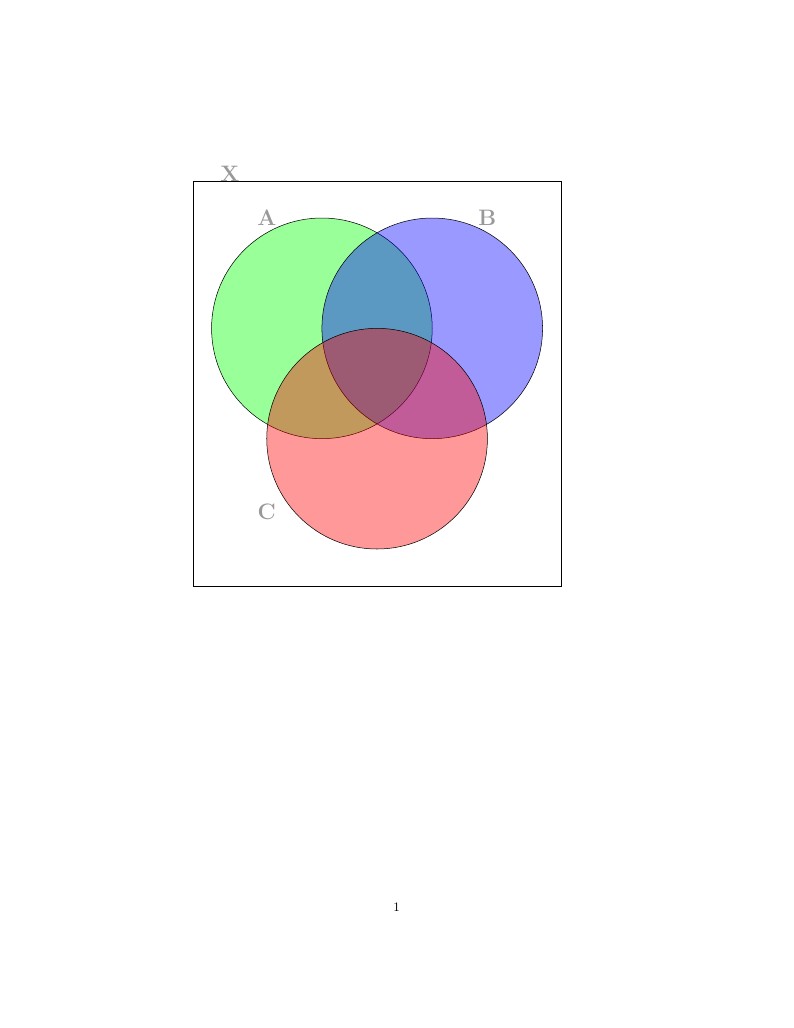
This is a short template on the creation of Venn Diagrams.
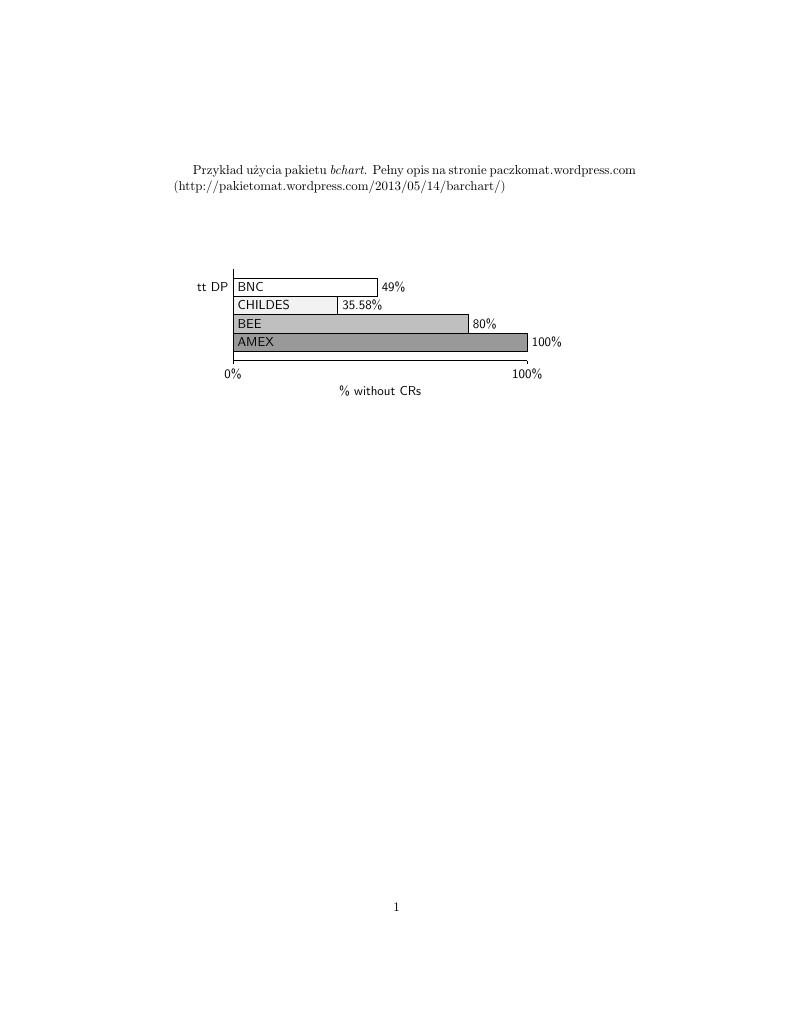
Bchart jest doskonałym pakietem, jeżeli chcesz szybko i wygodnie przygotować wykres słupkowy w LaTeX-u. Czytaj więcej na: http://pakietomat.wordpress.com/2013/05/14/barchart/
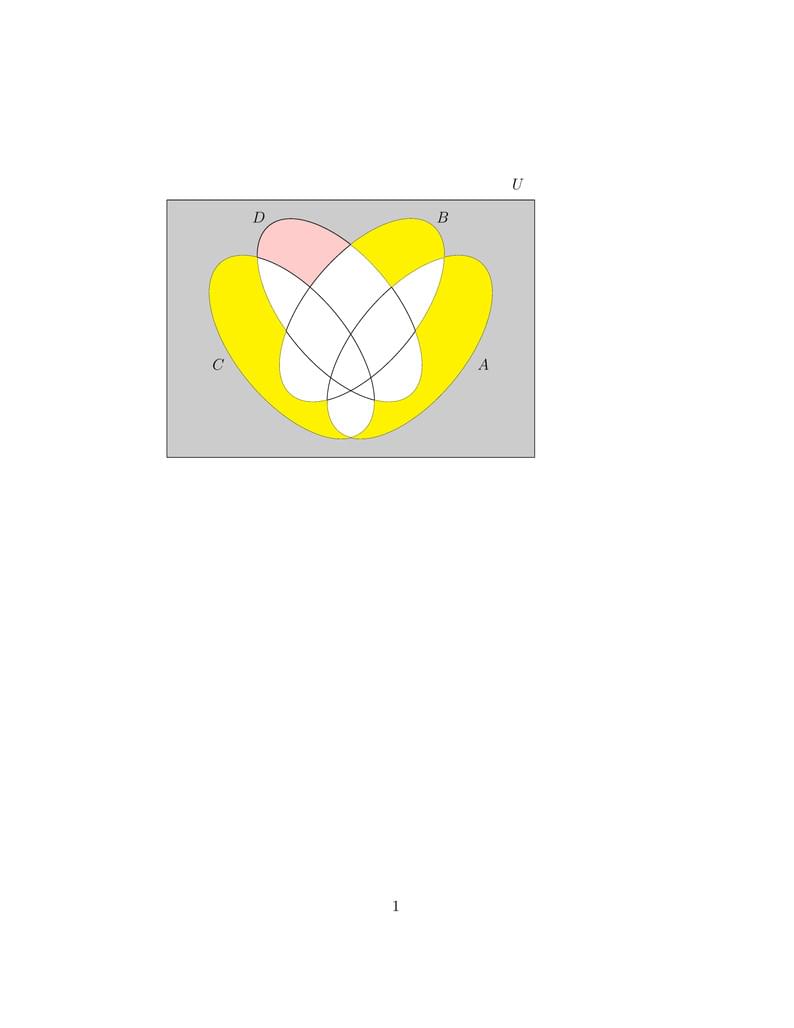
This example helps to show how the isolated areas of a Venn diagram can be filled / coloured. It was created as part of this answer on TeX StackExchange. Other options for creating Venn diagrams with multiple areas shaded can be found in the Overleaf gallery via the Venn Diagrams tag.
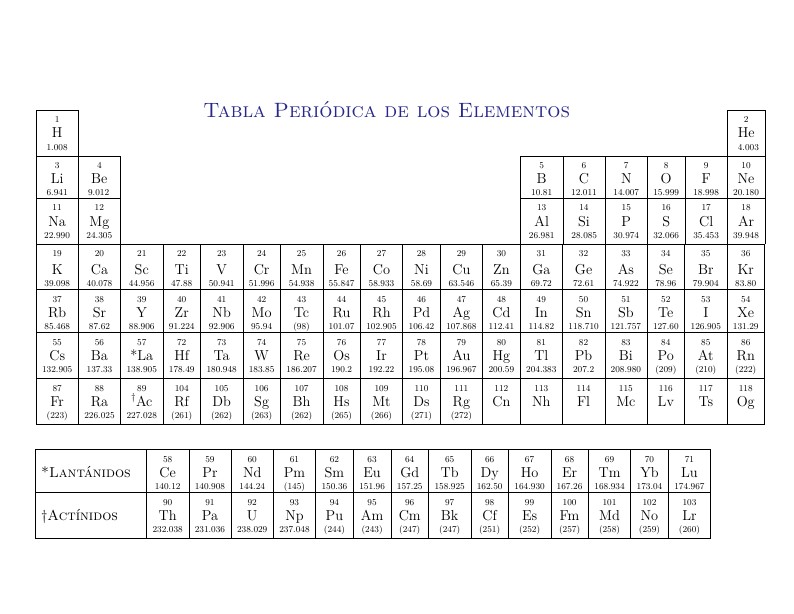
periodic table with all the known elements in Spanish
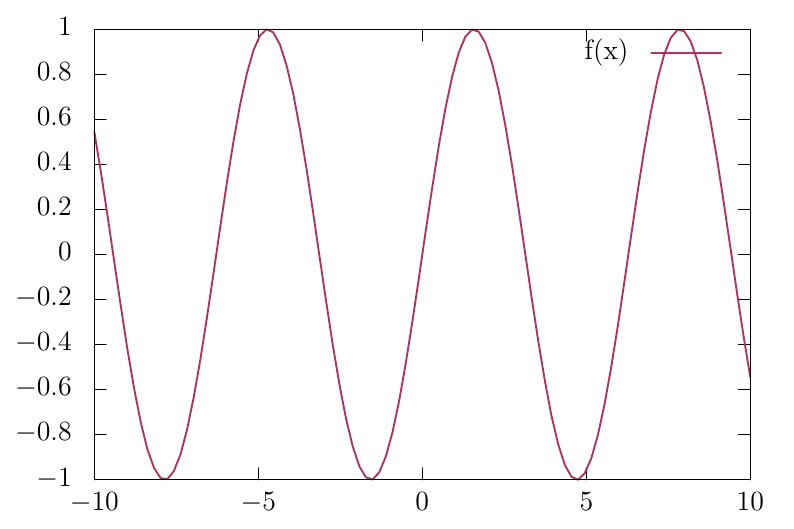
This is an example for re-creating gnuplot charts with tikz on LaTeX, made possible by adding gnuplot-lua-tikz.sty and gnuplot-lua-tikz-common.tex to your project. (These files can be generated by invoking lua gnuplot-tikz.lua style where gnuplot-tikz.lua can be found in $GNUPLOT/lua/gnuplot-tikz.lua. (This will work with all engines, not just LuaLaTeX!)
\begin
Discover why over 30 million people worldwide trust Overleaf with their work.