![PSTricks LaTeX Example 5: Graphing a trig function](https://writelatex.s3.amazonaws.com/published_ver/601.jpeg?X-Amz-Expires=14400&X-Amz-Date=20240727T004252Z&X-Amz-Algorithm=AWS4-HMAC-SHA256&X-Amz-Credential=AKIAWJBOALPNFPV7PVH5/20240727/us-east-1/s3/aws4_request&X-Amz-SignedHeaders=host&X-Amz-Signature=9ebf6a3ee09147972cb506c0c62575cea1366db637a0ddc5624fb443ca656d6f)
PSTricks LaTeX Example 5: Graphing a trig function
Author
Last Updated
před 10 lety
License
Other (as stated in the work)
Abstract
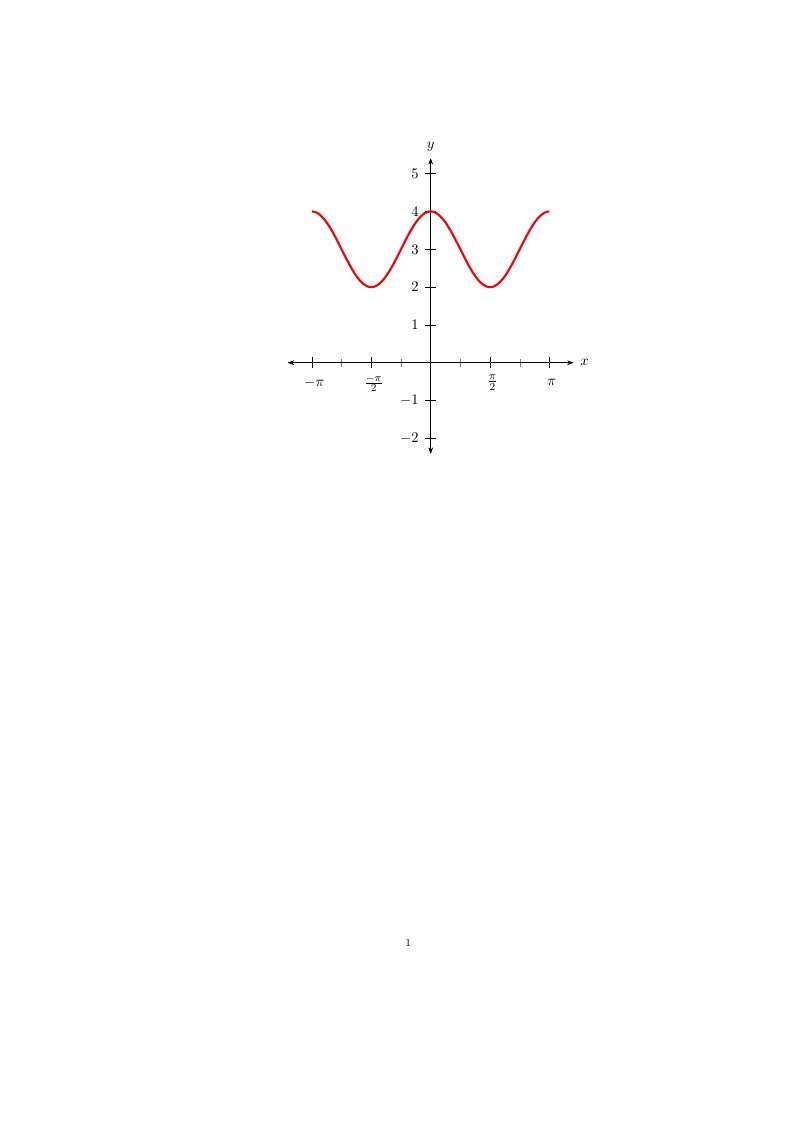
Following on from example 4 which showed how to plot the graph of a function in LaTeX using pstricks, here we extend the example to show how trig functions such as cos, sin and tan can be plotted.
Original source: http://www.thelazymathematician.com/p/pstricks-examples.html
![PSTricks LaTeX Example 5: Graphing a trig function](https://writelatex.s3.amazonaws.com/published_ver/601.jpeg?X-Amz-Expires=14400&X-Amz-Date=20240727T004252Z&X-Amz-Algorithm=AWS4-HMAC-SHA256&X-Amz-Credential=AKIAWJBOALPNFPV7PVH5/20240727/us-east-1/s3/aws4_request&X-Amz-SignedHeaders=host&X-Amz-Signature=9ebf6a3ee09147972cb506c0c62575cea1366db637a0ddc5624fb443ca656d6f)