HKUST Lab Report Template
Author:
Ma Wanqin
Last Updated:
před rokem
License:
Creative Commons CC BY 4.0
Abstract:
Lab Report Template for HKUST Students

\begin
Discover why over 25 million people worldwide trust Overleaf with their work.

\begin
Discover why over 25 million people worldwide trust Overleaf with their work.
\documentclass[a4paper,12pt]{article}

% Packages
\usepackage{graphicx}
\usepackage{amsmath}
\usepackage{geometry}
\usepackage{fancyhdr}
\usepackage{setspace}
\usepackage{titlesec}  % For title formatting
\geometry{margin=1in}
\setstretch{1.5}

% Header and Footer
\pagestyle{fancy}
\fancyhf{}
\fancyhead[L]{Lab Report Title}
\fancyhead[R]{\thepage}

% Title Formatting
\titleformat{\section}{\normalfont\Large\bfseries}{\thesection}{1em}{}

% Cover Page
\title{
    \vspace{2cm} % Adjust vertical space
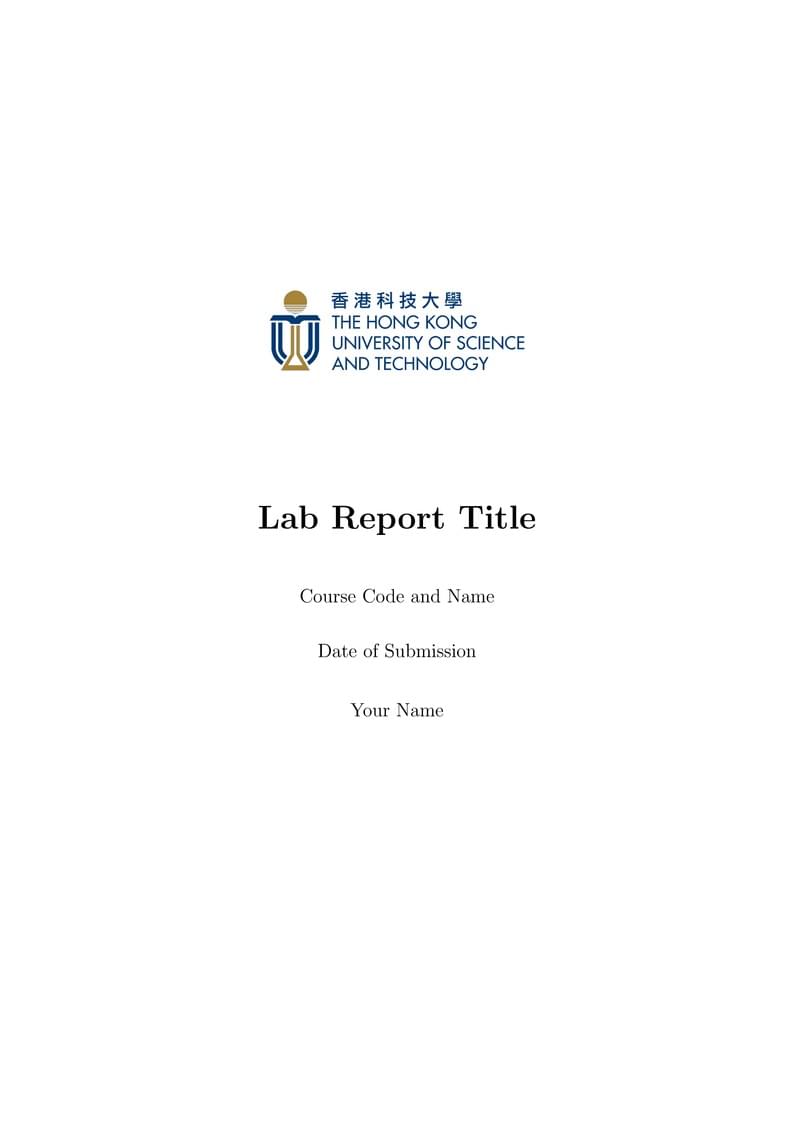
    \includegraphics[width=0.55\textwidth]{logo_hkust2.png} \\ % Add your logo here (change "logo.png" to the actual filename)
    \vspace{1cm} % Adjust vertical space after the logo
    \textbf{\Huge Lab Report Title} \\
    \vspace{1cm} % Adjust vertical space
    \large Course Code and Name \\
    \vspace{0.5cm} % Adjust vertical space
    \large Date of Submission
}
\author{Your Name}
\date{}

\begin{document}

% Title Page
\maketitle
\thispagestyle{empty}
\newpage

% Table of Contents
% Start page numbering from the Table of Contents
\setcounter{page}{1}  % Start counting from 1
\tableofcontents
\newpage

% 1. Objective or Summary
\section{Objective}
This section should briefly describe the main goals and objectives of the lab report.

% 2. Problem Description
\section{Problem Description}
Provide a detailed description of the problems or tasks tackled in the lab. This can include circuit specifications, structures, or any other given challenges.

% 3. Methodology/Design Procedures
\section{Methodology}
Detail the steps taken to design or implement the solution to the problem. Explain any algorithms, designs, or specific procedures used.

% 4. Measurement/Testing Results
\section{Measurement}
Summarize the data gathered during the lab, including measurements and observations. You can use tables or figures to present this data.

\begin{figure}[h!]
    \centering
    \includegraphics[width=0.8\textwidth]{example-image} % Example of adding a figure
    \caption{Test results for circuit 1}
    \label{fig:circuit1}
\end{figure}

% 5. Analysis and Discussion
\section{Analysis and Discussion}
Interpret the results obtained. Compare them with theoretical values, explain discrepancies, and discuss their significance.

% 6. Recommendations/Conclusions
\section{Conclusions}
Provide conclusions based on the results and discuss any recommendations for improvements, future work, or alternative solutions.

\newpage
% Bibliography (if required)
\bibliographystyle{plain}
\bibliography{references}  % Add a .bib file if you have references

\end{document}